I kinda think it's too late to jump all into SKW... MIssed that boat.
There's certainly no such thing as "too high" a price. Nobody thought AAPL would go from <$10/share to $705. Of course, the same can be said on the downside; lots of people have blown out accounts buying tumbling stocks due to perceived value, only to see it continue down and never recover.
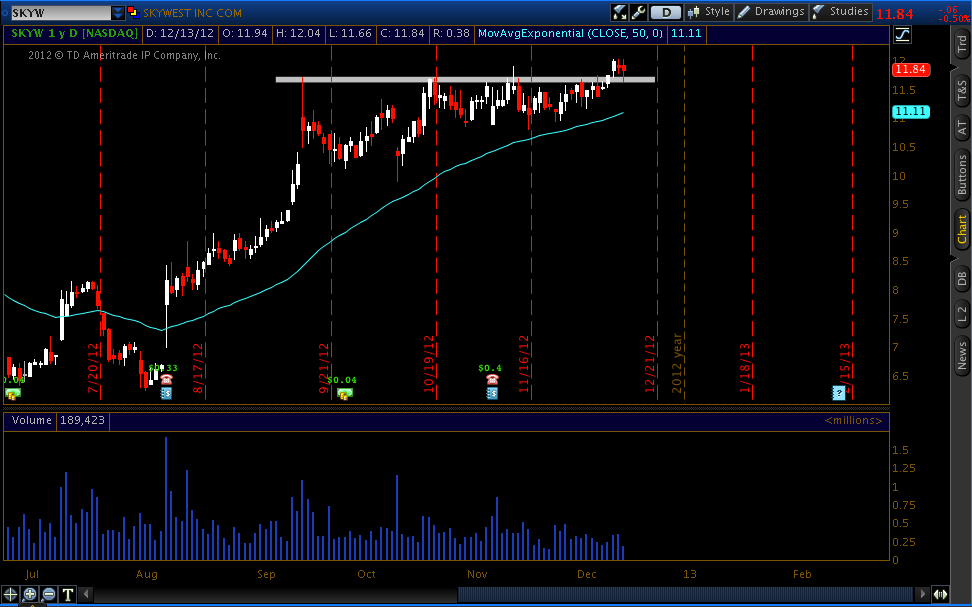
The price action "background" on SKYW has improved, at least in my mind. 9/14 showed strong sell-side energy hit the stock, followed by continual sell pressure at the ~$11.70 level for the next 2 months. There was a strong sign of demand shown on 10/10, however. Lots of mixed signals.
Beware of "pin" areas on a chart; they show areas of supply and demand that can work against you if you're trading in the opposite direction. The pin area of resistance on SKW is shown above as a gray rectangle, outlining a zone where sellers continued to put pressure on the stock on the downside. The only day that had previously closed in this zone was 10/18, but it was promptly rejected the next day.
The 12/10 candle closed into this pin area, which is should grab some attention. The buyers had control throughout the day, and weren't rejected as they had been previously. Volume was light, implying that buyers had very little difficulty pushing the price up. The very next day, the market followed through with a push into new high ground, closing on highs with healthy volume (too low, or too high volume would be suspect).
Today's price action showed an early push on low volume back down to "test" the pin area, but was rejected again, this time not being able to close the day down into that previous area. This "resistance becoming support" (or vice versa) is very common in all markets. Buyers had very little difficulty pushing the price back up out of the previous resistance area, implying that the floating supply that had been banging against the stock for the past 3 months has abated, at least for now.
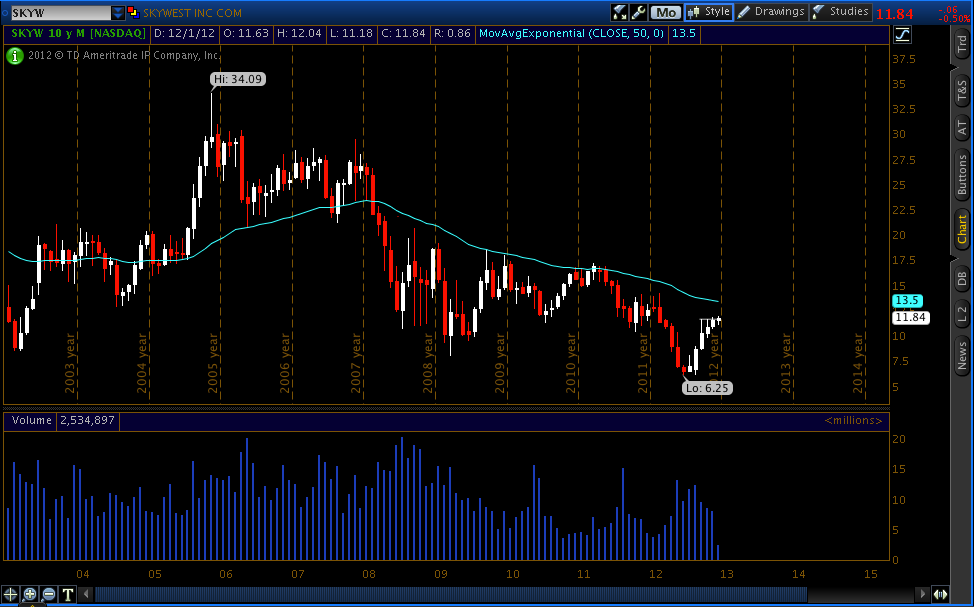
However, it's very easy to get caught up in all of this analysis, and ignore the big picture. The big picture (monthly view) does show a stock that's hit recent new lows, and has a long way to go before it reaches previous trading levels. The daily chart shown above may show a decent short-term trading opportunity, but anyone trading this should be nimble, keeping in mind the overall weakness of the big picture. When in doubt, zoom out.
")
(The above is not trading/investment advice, by the way. I am
not trading this in my own account).
")