Hopefully I'm not opening up a huge debate here, but I can't really think of a good way to simply explain why we adjust power to change the rate of descent. It's pretty easy for me to explain the whole pitch for airspeed (drag) deal, but what's a good way to explain why increasing power causes us to climb, for example being trimmed for 100 knots in cruise, we add full power and the airplane pitches up and begins climbing. But why exactly? The best I can come up with is "because that's just how it works." Funny how trying to explain basic stuff gives me so much trouble.
You are using an out of date browser. It may not display this or other websites correctly.
You should upgrade or use an alternative browser.
You should upgrade or use an alternative browser.
Best way to explain why power changes altitude
- Thread starter JordanD
- Start date
jmc4
Well-Known Member
My guess is the plane wants to go up. The wings, generating vertical lift, are countered by the horizontal stabilizer, elevators, and trim. More power = more lift generated because of faster airspeed.
Disclaimer: (This is how I THINK my flight instructor explained it. I'm barely over 100 hours and a big n00b, please comfirm or deny my assumption. Thanks.)
Disclaimer: (This is how I THINK my flight instructor explained it. I'm barely over 100 hours and a big n00b, please comfirm or deny my assumption. Thanks.)
rframe
pǝʇɹǝʌuı
It's all about longitudinal (pitch) stability which is provided through a CG which is forward of the center of lift so the airplane naturally wants to pitch down and requires that the horizontal stabilizer and elevator must counter-act this by producing a tail down force.
You have to remember the horizontal stabilizer and elevator aren't just trailing through the air but are normally acting as an upside down wing, pulling down on the tail... if airspeed decreases (like by you reducing the power/thrust) then that inverted wing has less effect and cannot counter act the natural nose down tendency of the airplane so it pitches down slightly and starts to descend.
If the airspeed increases (like by you increasing power/thrust) then that inverted wing on the tail becomes more effective and pulls down harder on the tail, causing the airplane to pitch up and climb.
This is why elevator trim is essentially your airspeed autopilot control. For any given weight/CG the elevator trim will balance at a particular airspeed.
More power = more thrust = more airflow over the tail = more tail down force = pitch up movement = climb at same airspeed.
Less power = less thrust = less airflow over the tail = less tail down force = CG pulls nose down = descent at same airspeed.
Review the Pilot's Handbook of Aeronautical Knowledge, Chapter 4, page 4-14 and 4-15
Der_Meister
Well-Known Member
you climb because you now have excess power. The airplane pitches up because of the increase airspeed over the elevator creating lift in the downward direction. This intern causes the AOA on the main wing to increase creating more lift causing the climb.
Pay2
Oberkellner
Here's how I explained it. Please, anyone feel free to correct me if I'm wrong, but this is how I understand lift.
More power equals more airflow over the airfoil which can do two things: increase speed or lift (or a combination). If you are trimmed for a climb at 100 knots and you increase the power the aircraft will accelerate unless pitch is increased to maintain 100 knots. Remember that an aircraft in a steady state is in equilibrium. If power is increased then so is lift, and you will either change airspeed or altitude (depending upon control inputs) to regain equilibrium.
Hope that was clear. It was a lot clearer before I started typing.
So is this more of a result of the airflow from the propeller hitting the tail, or the airplane actually speeding up temporarily, increasing downforce, then causing the pitch up which in turn increases drag and causes you to slow down? How much of a difference does it make in a T-tail where the elevator is mostly out of the prop wash? I don't have any time in a T-Tail aircraft so I haven't gotten to experience it first hand.More power = more thrust = more airflow over the tail = more tail down force = pitch up movement = climb at same airspeed.
Less power = less thrust = less airflow over the tail = less tail down force = CG pulls nose down = descent at same airspeed.
Regarding the tail, so would pulling back on the yoke technically increase the angle of attack of the elevator, when you're pointing the upside down wing towards the ground?
Kind of embarassing to be asking these as a CMEL pilot, but I feel like the FAA doesn't do me any favors explaining everything in clear terms.
rframe
pǝʇɹǝʌuı
Yes prop slipstream makes a huge difference in the relative airspeed over the tail. Remember what happens during a go around, when you're already trimmed for a slow airspeed and you bring in full power? The nose wants to point to the moon unless you check it with forward elevator pressure....that's fast relative air being thrust back from the prop hitting that trimmed tail and it's wanting to find it's balanced airspeed even though the rest of the airplane isn't moving that fast.
The same thing happens from just general airspeed changes of the aircraft, but they are less abrupt simply because the air speed acceleration changes are less sudden. Trim for straight and level and dont touch the power but push the nose down for 5 seconds and what happens? The airplane will probably enter a series of small waves of climbs and descents as the forces all balance back out.
Yes when you pull back on the yoke the elevator goes up, right? Draw a line from leading edge of horizontal stabilizer to the trailing edge of the elevator and you now see the chord line of the "upside down wing" and you can see that the angle of attack has increased on that tail.
A150K
Well-Known Member
In many ways, the basics are the hardest thing to teach. You should have seen me trying to teach my CFI straight and level during CFI training.Hopefully I'm not opening up a huge debate here, but I can't really think of a good way to simply explain why we adjust power to change the rate of descent. It's pretty easy for me to explain the whole pitch for airspeed (drag) deal, but what's a good way to explain why increasing power causes us to climb, for example being trimmed for 100 knots in cruise, we add full power and the airplane pitches up and begins climbing. But why exactly? The best I can come up with is "because that's just how it works." Funny how trying to explain basic stuff gives me so much trouble.

CoffeeIcePapers
Well-Hung Member
The aircraft will climb if it has excess thrust. Lift will be equal to the weight.
PHAK 4-21 has a good explanation. Lift might temporarily be greater than weight, but it will quickly equalize. The flight attitude might change, but the AOA stays basically the same, as the relative wind changes. We need excess thrust, because now some of the weight is being seen as drag.

The F16 proves this example:
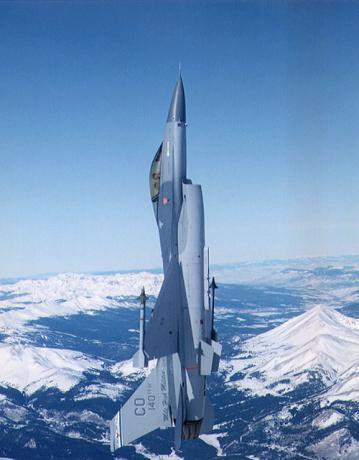
It has enough excess thrust to overcome the weight and drag, so it can do a vertical climb.
The immediate pitch up/pitch down with an increase in power/descrease in power is due to the horizontal stab, like rframe described in the first post. That is in the Private Pilot Knowledge Test.
tgrayson was great for these types of posts. shdw might offer some insight, as well.
PHAK 4-21 has a good explanation. Lift might temporarily be greater than weight, but it will quickly equalize. The flight attitude might change, but the AOA stays basically the same, as the relative wind changes. We need excess thrust, because now some of the weight is being seen as drag.
The thrust required for a stabilized climb equals drag plus a
percentage of weight dependent on the angle of climb. For
example, a 10° climb would require thrust to equal drag plus
17 percent of weight. To climb straight up would require
thrust to equal all of weight and drag. Therefore, the angle
of climb for climb performance is dependent on the amount
of excess power available to overcome a portion of weight.
Note that aircraft are able to sustain a climb due to excess
thrust. When the excess thrust is gone, the aircraft is no
longer able to climb.
The F16 proves this example:
It has enough excess thrust to overcome the weight and drag, so it can do a vertical climb.
The immediate pitch up/pitch down with an increase in power/descrease in power is due to the horizontal stab, like rframe described in the first post. That is in the Private Pilot Knowledge Test.
tgrayson was great for these types of posts. shdw might offer some insight, as well.
MidlifeFlyer
Well-Known Member
The problem is that when we try to think of power and pitch as separate things rather than as a combination. You don't climb while adding power - unless you are also using pitch to maintain airspeed. Change that dynamic - use pitch to allow the airplane to maintain altitude, and all the power will do is increase airspeed.
That's ultimately where the huge but incredibly silly pitch/power argument comes from - trying to separate the two from each other as it they control things apart, rather than together.
That's ultimately where the huge but incredibly silly pitch/power argument comes from - trying to separate the two from each other as it they control things apart, rather than together.
In level, unaccelerated flight, all forces are in balance. Increase the power, now the forces are no longer balanced, and the airplane should do what it needs to toget those forces "rebalanced." That would be a pitch up. If you want to increase speed, you have to step in and get those forces back in balance. Not by pitching down, but maintaining altitude, and re-trimming.
virial
Well-Known Member
It's an energy balance. In the airplane you have three sources of energy:
1) Momentum - Kinetic Energy
2) Altitude - Potential Energy
3) Fuel - Potential Energy
If you increase power, you are cashing in some chemical potential energy - which needs to go somewhere. If you're not getting more kinetic energy out of this exchange, you must be exchanging it for another form of potential energy. In this case, altitude.
pwapilot
Well-Known Member
The problem is that when we try to think of power and pitch as separate things rather than as a combination. You don't climb while adding power - unless you are also using pitch to maintain airspeed. Change that dynamic - use pitch to allow the airplane to maintain altitude, and all the power will do is increase airspeed.
To directly answer the OP's question ("what's a good way to explain why increasing power causes us to climb"), consider an aircraft in straight and level, steady flight. Adding power causes the aircraft to accelerate forward (T>D). Immediately, the lift increases and the aircraft accelerates upwards. The upward motion of the aircraft leads to a downward component of relative wind. This decreases the angle of attack and the lift, but the aircraft's positive static stability causes a positive (up) pitching moment to counteract this, explaining both why the aircraft starts climbing and starts pitching up (neglecting prop wash and thrust centerline pitching moment effects). None of this required the use of the elevator, although in reality you would want to use the elevator to quickly damp out the decaying phugoid oscillation that would otherwise result.
That's ultimately where the huge but incredibly silly pitch/power argument comes from - trying to separate the two from each other as it they control things apart, rather than together.
They certainly are related, but each control on its own unarguably has a primary effect in the long run (steady state). As we all realize, applying up elevator on the front side of the power curve does cause a climb. But why? Sure, there is a transient increase in lift due to the elevator deflection increasing the angle of attack, but the real reason why you keep climbing in the long run (i.e., once your vertical speed is stabilized) is that the elevator deflection changed your airspeed. Assuming you haven't touched the throttle, at this new, higher speed, you now have excess thrust, which is what you need to sustain a climb.
Obviously, another way to get excess thrust is to push the throttle forward enough. In the long run, your speed will be approximately the same (aside from small differences that may result from prop wash and thrust centerline effects) as before you pushed the throttle forward, once the ugly phugoid oscillations damp out enough.
In summary,
- The only way to get a steady state rate of climb or descent is to have excess thrust (T>D) or a thrust deficit (T<D). There are two ways to get excess/deficit thrust:
- Throttle setting changes. (See how this works at the beginning of this post.)
- Airspeed changes using the elevator. The problem with teaching this as the primary method to change vertical speed is that it only works in expected way on the front side of the power curve. This is of course the more practical method when really small VS corrections are to be made (like on an ILS), but the reality is that the primary effect of the pitch (technically, angle of attack) changes is to change your airspeed. The secondary effect, due the change in drag resulting from the airspeed change, is the climb/descent.
- The only way to change your airspeed in steady state is to change your elevator deflection. (If you're hung up on the idea that pushing the throttle forward is the primary way of making you go faster, remember that we're talking about the effect of each control on its own. If you want to know the effect of the throttle on its own, read the beginning of this post)
Makes perfect since. Thanks everyone.
Regarding the horizontal stabilizer, does it actually produce lift in the opposite direction of the wing because it is curved on the bottom (noticeable on some planes more than others), or is this a simplified explanation to try to make it easier to understand? I understand how the down wash from the wing hits it, but what about t tails where there is no down wash from the wings?
Regarding the horizontal stabilizer, does it actually produce lift in the opposite direction of the wing because it is curved on the bottom (noticeable on some planes more than others), or is this a simplified explanation to try to make it easier to understand? I understand how the down wash from the wing hits it, but what about t tails where there is no down wash from the wings?
pwapilot
Well-Known Member
That's not necessarily the case (some aircraft may use a symmetric airfoil on the horizontal stabilizer), but yes, a negative camber would help produce tail down force. The other factors involved are the downwash from the main wing causing a more negative angle of attack, like you note, and a possible negative angle of incidence on the horizontal stabilizer. The extent of these vary from design to design.
gotWXdagain
Polished Member
All that stuff that others said. You know, the stuff about power making you go forward faster, and your control inputs changing your forward motion to upward motion. that stuff.
Boris Badenov
Fortis Leader
I guess I'm an iconoclast, but when I was a CFI, I simply said "you need to treat it as though..." rather than stating something that is really, deep down, untrue as fact. A student can go as deep in to aerodynamics as they care to...anything from just north of "pull back the houses get bigger" to just south of building a space shuttle. If they were super unmotivated, I would just tell them to read the FAA pub and be able to regurgitate the info presented there.
I did find that those who understood the aerodynamics better tended to do better (or at least progress more quickly), but you know...you can lead a horse to water, etc etc.
I did find that those who understood the aerodynamics better tended to do better (or at least progress more quickly), but you know...you can lead a horse to water, etc etc.
Well I don't think you will find tgray around these parts anymore, but I will give it a shot. Thanks for queuing me into this thread, I'd have missed it otherwise!
rframe Had it with longitudinal stability. However, the discussion of the tail's interaction in the process needs some serious tweaks.
JordanD It isn't embarrassing, it's typical. The reason we find ourselves in trouble explaining basics is because we forget to first make them basic! We try instead to take a complex system as is and make it simple through explanation. Instead, simplify the complex and then work off of your simplified model.
In this case, our simplified model is:
- Thrust line is through the CG.
- The wing and horizontal tail are not submersed in the slipstream.
- Lift will be exactly equal to weight.
Before we move on, let's touch on the purpose of the horizontal tail. The horizontal tail provides a tail down force equal to the rotational moment produced by the main wing. Remember that center of pressure shifts forward as we increase the main wings AOA? This means that for any specific airspeed we will have a specific main wing AOA that requires a specific quantity of tail down force.
Now let's look at what is happening, in our simplified model of course. Assume cruise at 80 percent power and 100 knots. Our 100 knots, as we just mentioned, gives us an exact AOA and exact requirement for tail down force; which we've trimmed for. Now we add full power, which remember is not causing any change to local flow velocity on any of our wings in our simplification.
What occurs at this point is the airplane chasing it's trimmed speed. If we could graph it, it would look like steps. Speed would increase/AOA decrease slightly (unnoticeable to our instruments) and the airplane would adjust as needed to keep the speed constant; in this case a progressively increasing upward pitch. This process would continue until our final pitch attitude is achieved, now climbing, and with the airspeed identical to cruise airspeed. This all happens, like rframe said, because of our longitudinal stability.
------BREAK------
While the above gives you what is happening on paper. Whether or not you can make sense of/apply it, and get your student to make sense of it, is questionable. What you can do though, is a really cool experimentation lesson. Here:
Lesson: Power and the power required curve
Time: 2-2.5 hours (1-1.5 flying)
Materials: Airplane, brain, paper, ruler, pen/pencil, and patience
Purpose: To plot and learn the meaning of a power required curve. To explore the use of power. To build precise flying skills through the entire flight speed envelope.
Prep: Set up a graph on your piece of paper. On the vertical line, mark power settings in RPM (or MP if using a complex aircraft) and make tick marks at half inch intervals. Mark each tick mark with a corresponding RPM starting with 1200 (~idle) as the first tick mark and up to 2400. On the bottom mark speed, half inch tick marks, and 10 knot intervals starting with stall speed as the first tick mark.
I.E. For a 172R with a clean stall speed of 44, I start my tick marks with 45-55-65-etc.
Fly: Now take each of your 10 knot interval airspeeds and go flying. Fly at each speed and record the power setting. Be sure you are trimmed hands off for a substantial period (5-10 seconds) before recording the power setting. When you're done return to the ground.
Graph: Take your graph and fill in the data you just recorded, connect the dots, and notice the shape of the power curve exactly follows what you've seen in books. Do note you can do this experiment with 5 knot intervals to have a more accurate graph, but it takes much longer.
Discuss and fly again: Once you have the graph plotted, discuss what you plotted, and how it compares with the graphs you see in the book. Talk about how each of those points on the graph represent the power setting required to fly level flight at a specific speed. Finally, come up with some experiments based on that information to test this 'power to control rate of climb' topic.
For instance, if it took 1600 RPM's to hold 75 knots, go up and trim 75 knots at 1800 RPM. Or 75 knots at 1300 RPM. Do this with a couple instances and then go up for another 30 minutes and fiddle around with it. Let the student experiment.
I believe thoughtful experiments like this, with good guided discussion from the CFI, will be far more beneficial to your student than simply rattling off what you read in the book. Instead, link the theory to the practice and help them understand how the theory can be applied. Good luck. Thoughts?
They certainly are related, but each control on its own unarguably has a primary effect in the long run (steady state). As we all realize, applying up elevator on the front side of the power curve does cause a climb. But why? Sure, there is a transient increase in lift due to the elevator deflection increasing the angle of attack, but the real reason why you keep climbing in the long run (i.e., once your vertical speed is stabilized) is that the elevator deflection changed your airspeed. Assuming you haven't touched the throttle, at this new, higher speed, you now have excess thrust, which is what you need to sustain a climb.
I loved your post. Far more precise than my own. I think you had a mistype though. On the front side, higher speed gives (T<D) or a descent, not a climb. However, pulling up on the front side lowers your speed and reduces drag. Giving (T>D) or a climb. So the bold should read, at this new, lower speed, you now have excess thrust,.